Live 3D monitoring for critical rooms
Your BMS knows something is wrong. Do you know where?
Every cooling unit, UPS, battery string, rack and sensor in one live 3D view. Built from your drawings or your own 3D model. Running on site, without internet.
- Data-centre halls
- UPS and battery rooms
- MDF/IDF rooms
- Niagara · BACnet · Modbus · MQTT
Try it on one of your rooms: a 2-week pilot.
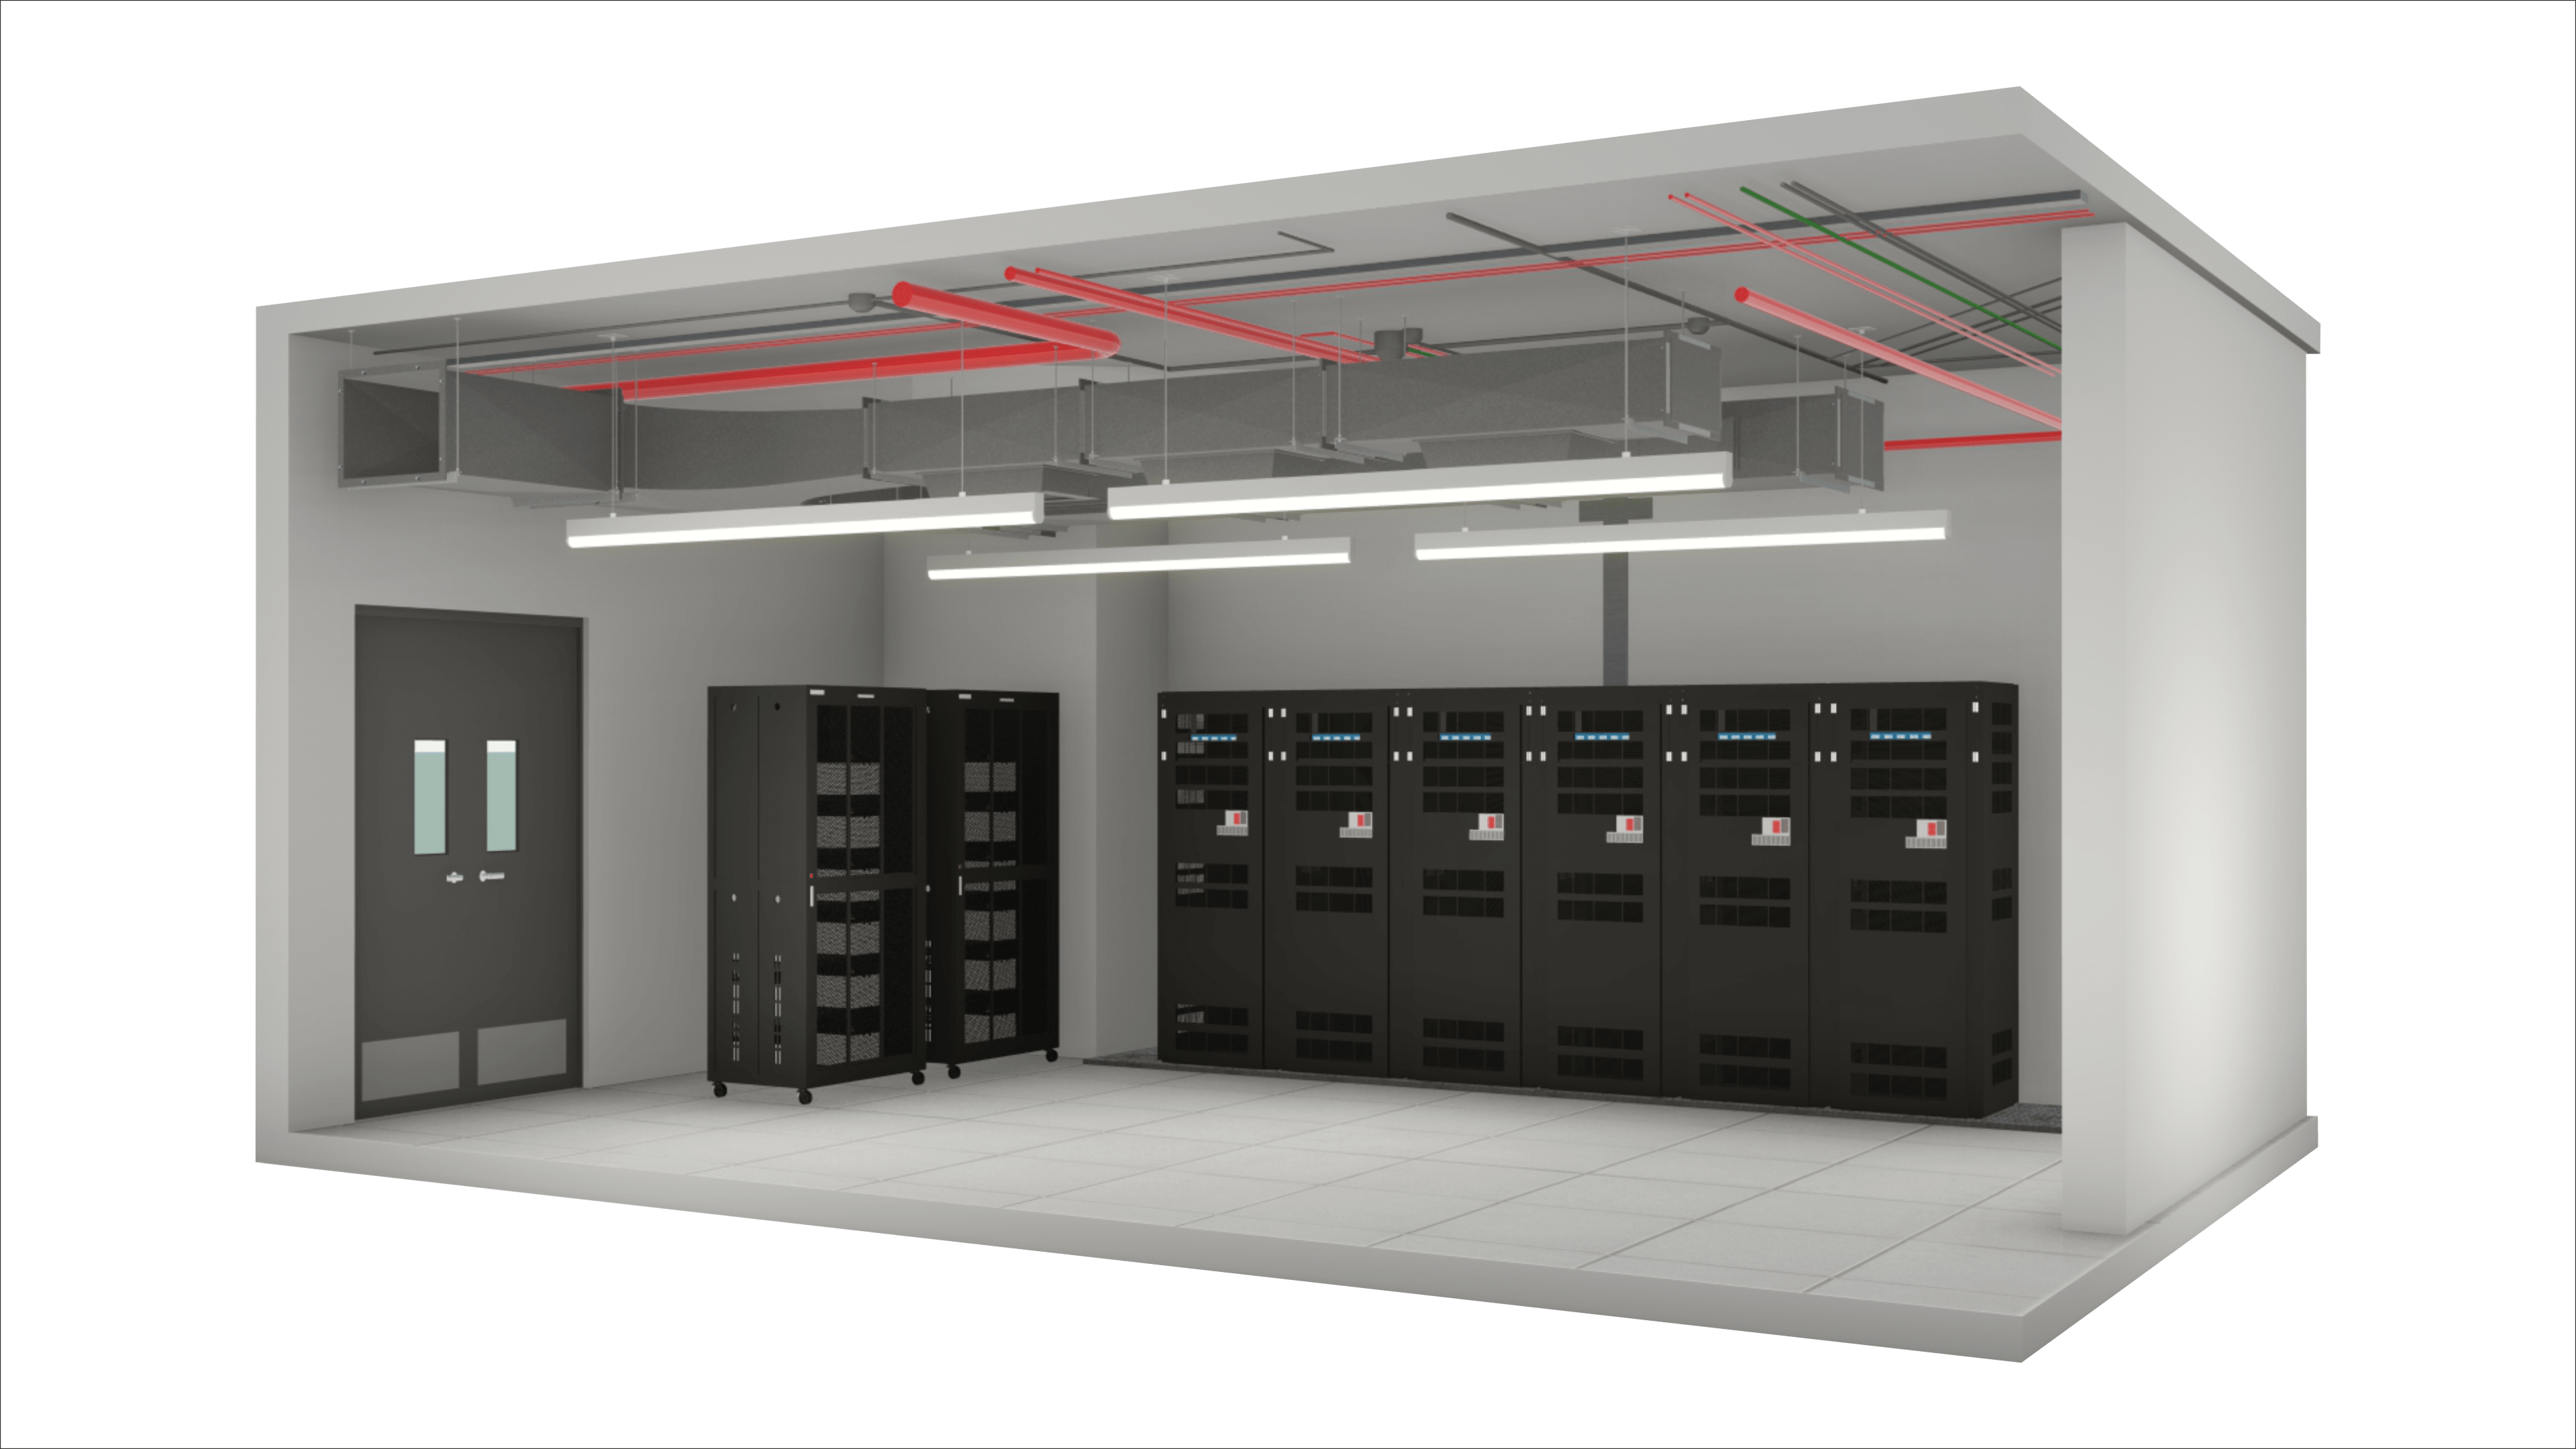
01 / Find it
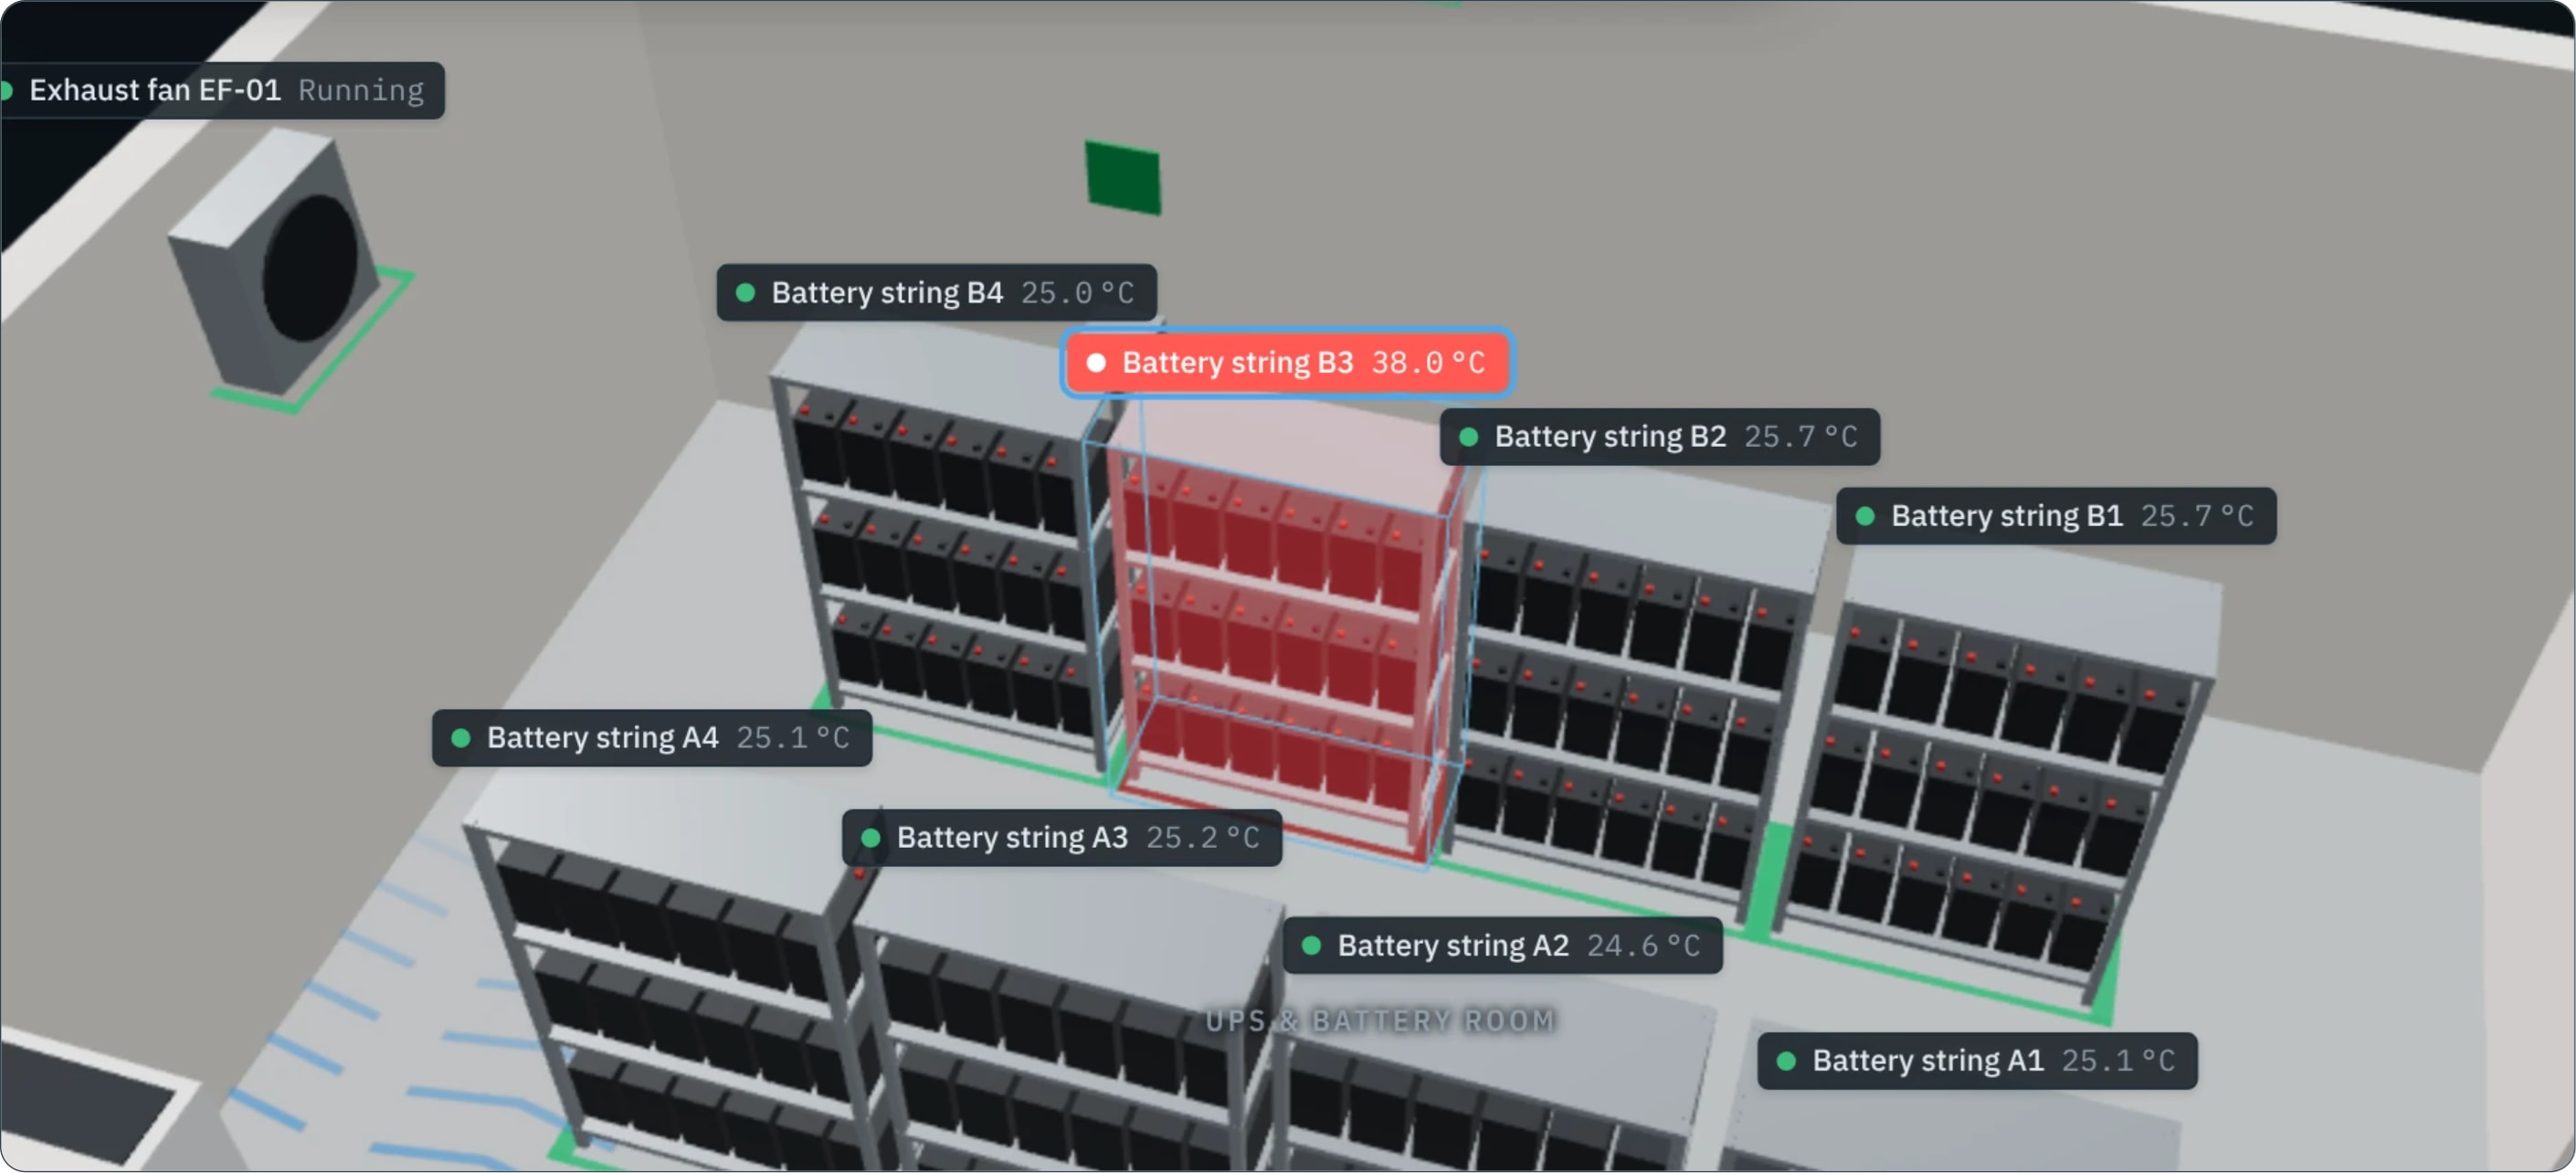
The alarm is the loudest thing on the screen.
Colour is kept for equipment state, so a fault stands out at once. One click shows its trend, its neighbours and the MQTT topic behind every value.
02 / Your 3D model
Already paid for a 3D model? Put it to work.
Drop the SketchUp, Revit, 3ds Max or Blender export into Model Studio. It finds the equipment by name, you check the matches, test with simulated data and publish.
- 1ModelDrop the export: GLB, glTF, FBX, OBJ or COLLADA
- 2AlignUnits and up axis guessed for you; set north
- 3EquipmentMatches found in object names, accepted in one click
- 4TestWatch it run on simulated live data
- 5PublishOne twin package and model, served from your site
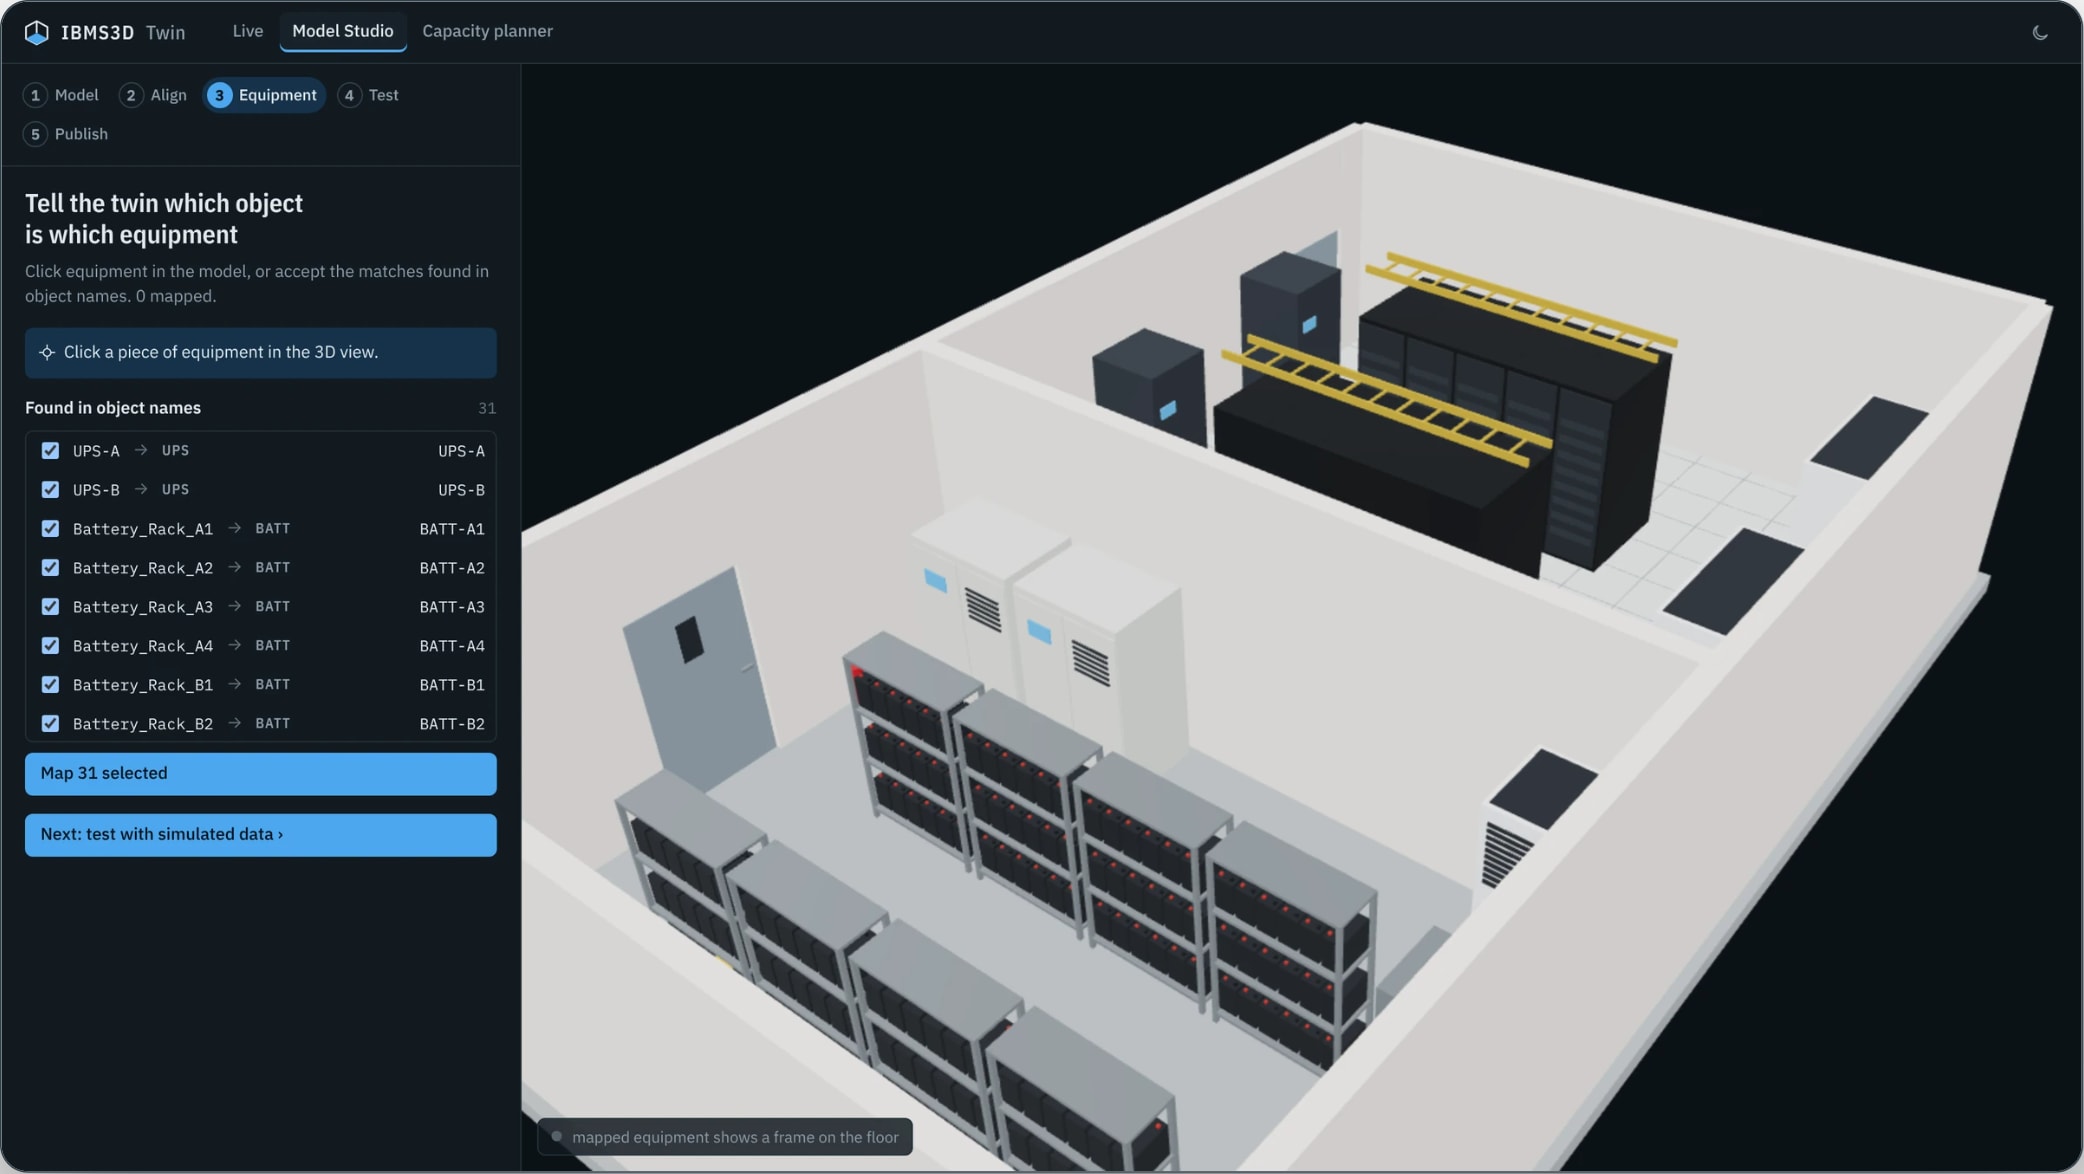
Sample SketchUp battery room: 31 pieces of equipment found from object names
03 / From your drawings
No 3D model? We’ve got you covered.
Send us your 2D CAD drawings. We build an accurate 3D model of your room, place every piece of equipment and tag it for live data. You don’t model a thing.
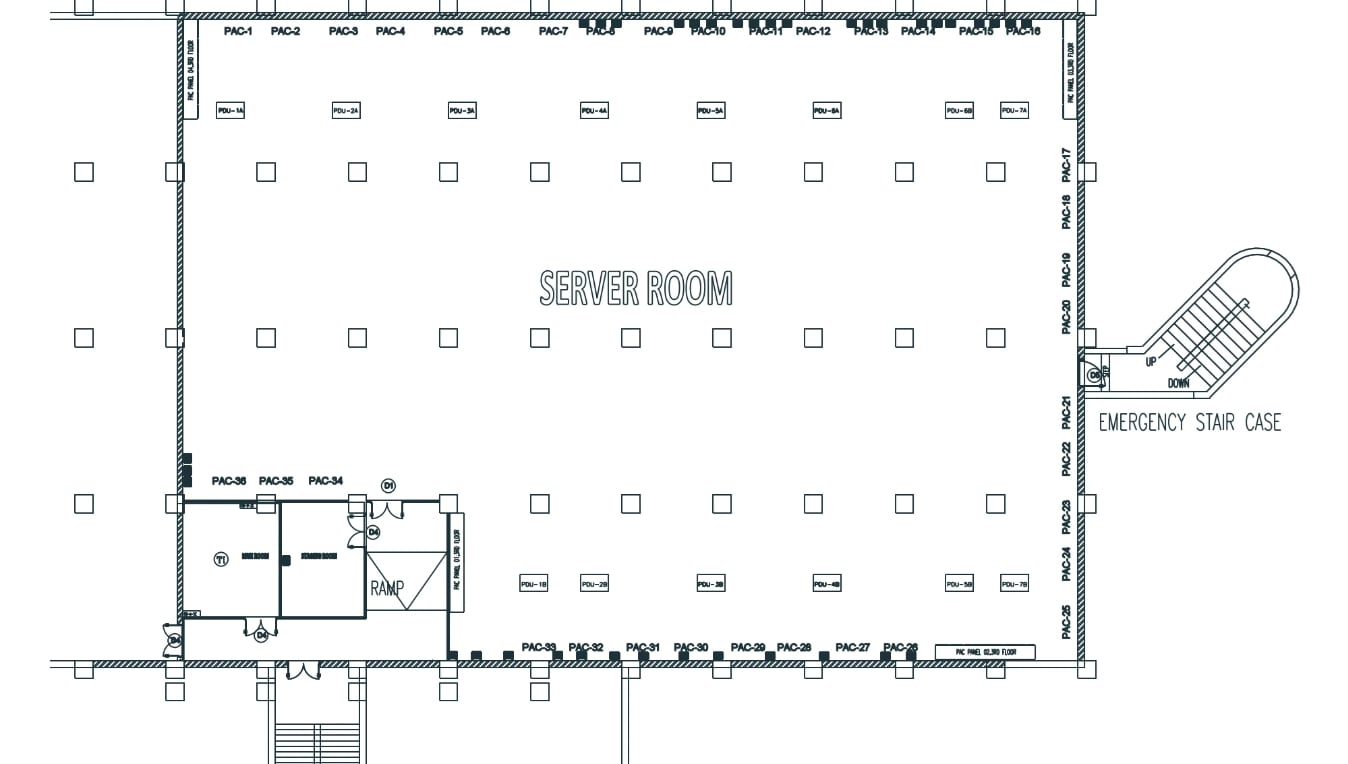
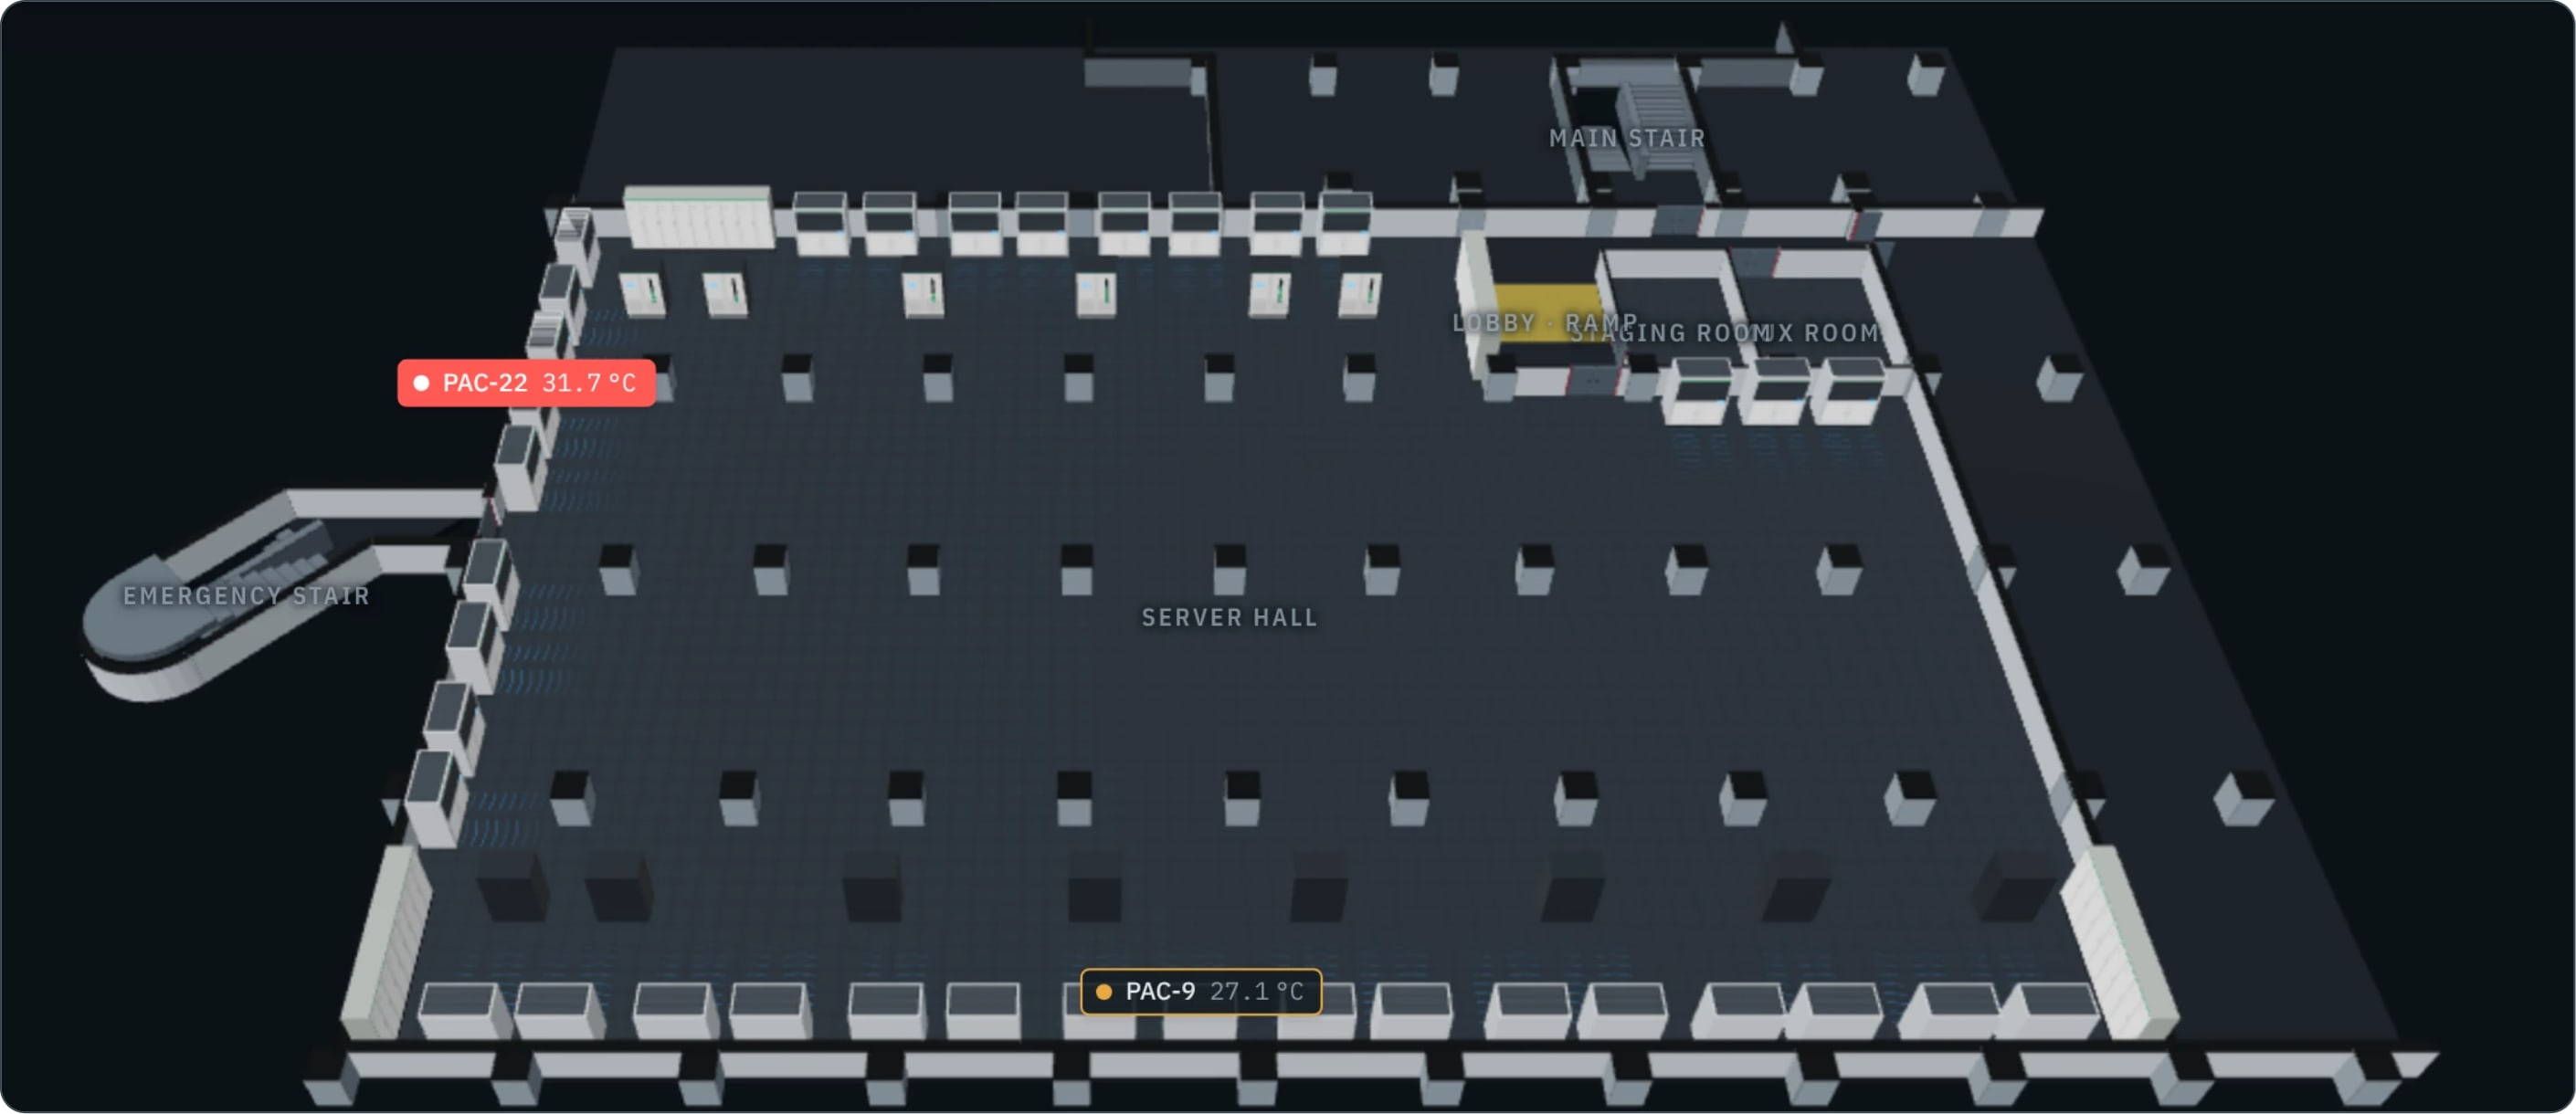
Above: the as-built DXF of a third-floor server hall, and the twin built from it. 98 items, 441 live points.
- 1
Send what you have
DWG, DXF or PDF drawings, plus your equipment list if you keep one.
- 2
We model and tag it
Walls, doors and every unit at the drawing’s real dimensions, matched to your BMS tags.
- 3
You check it, then go live
Walk through the model first. Any tag that doesn’t match your site is listed for you.
Not sure your drawings are good enough?
Send them anyway. We’ll tell you exactly what’s missing.
Send my drawingsYour drawings stay confidential. NDA on request.
04 / Runs on site
One small box per site. No internet needed.
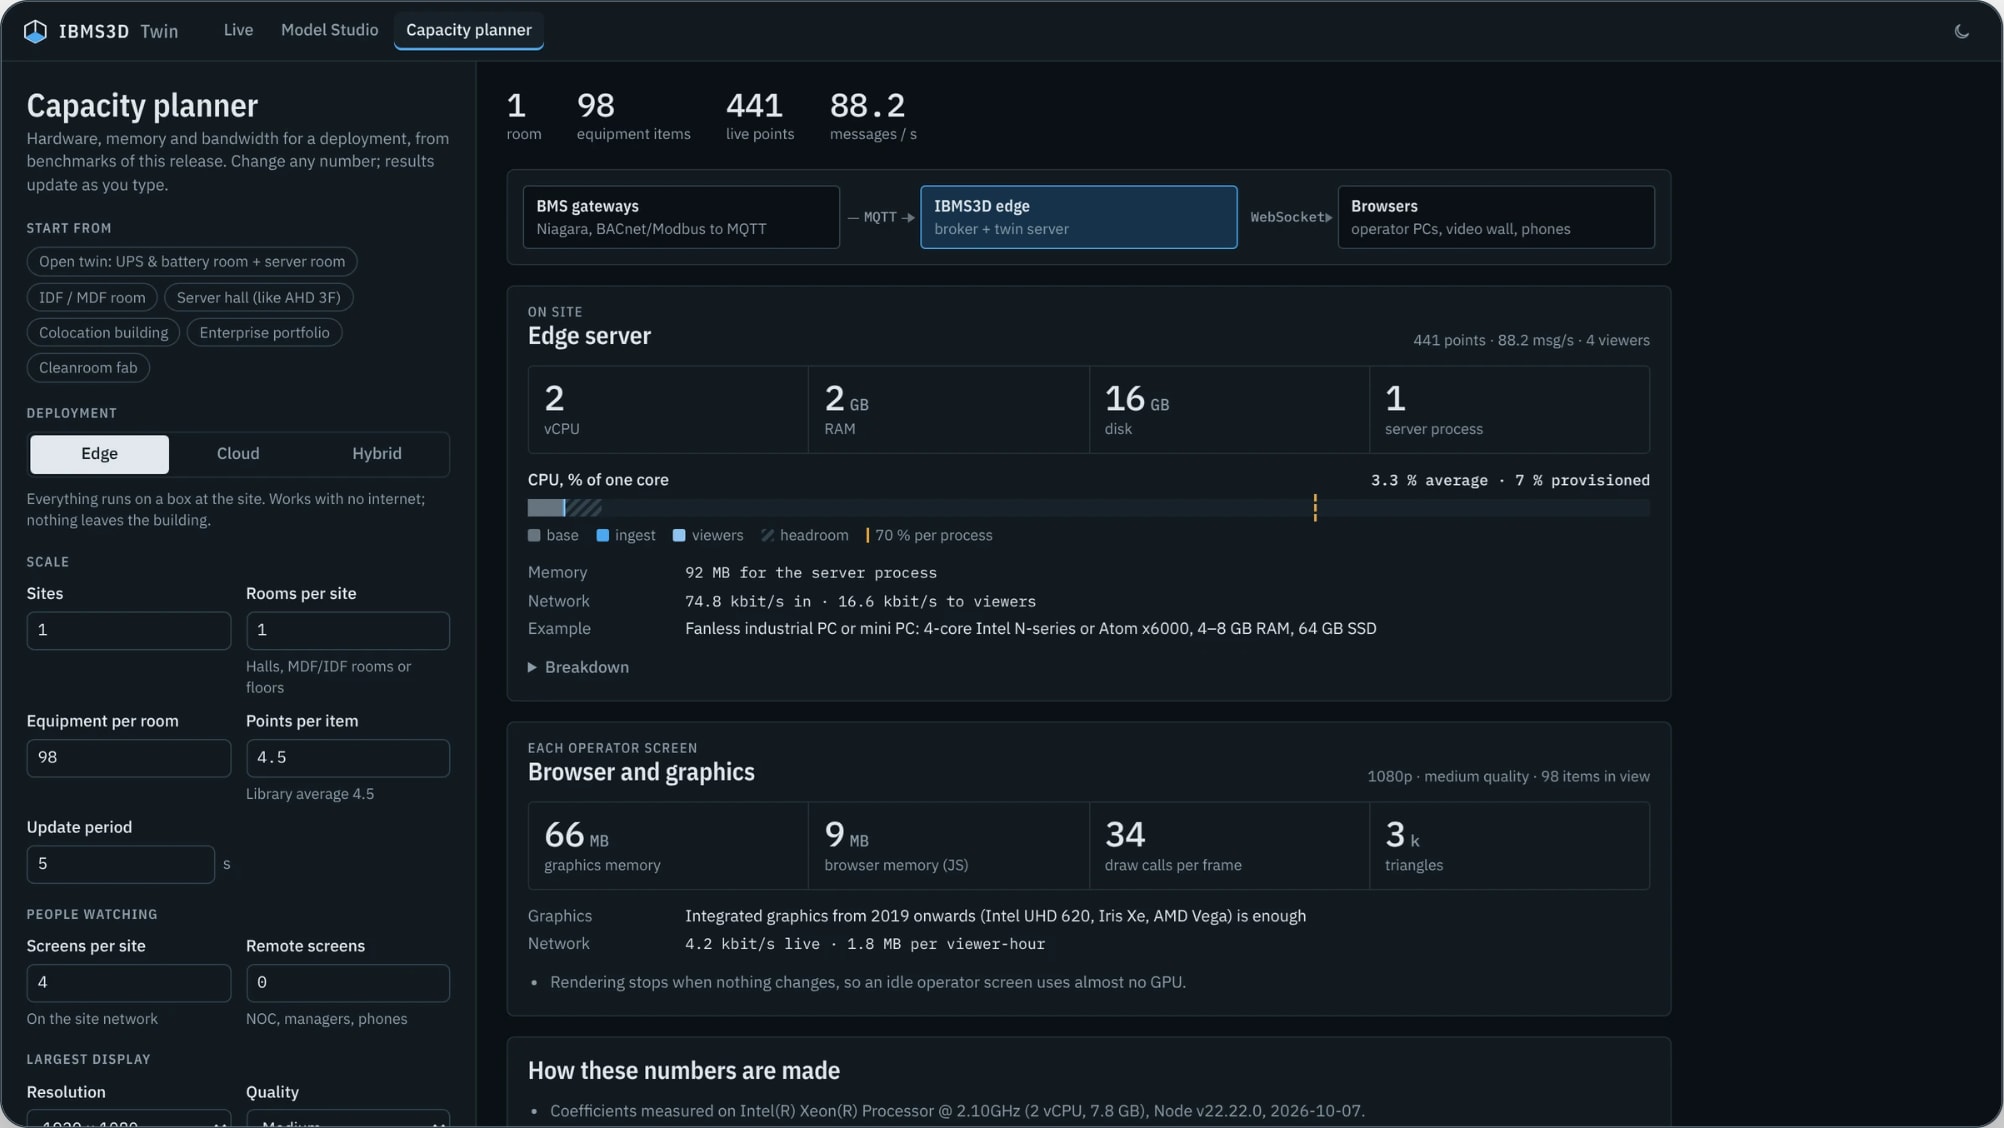
Broker, server and screens run inside your BMS network. The capacity planner gives you the hardware before you buy it, from measured benchmarks.
- 2 GB RAM, 16 GB disk for a whole server hall
- 2 vCPU
- of one CPU core, on average
- 3.3 %
- memory for the server process
- 92 MB
- graphics memory per 1080p screen
- 66 MB
Measured for the AHD server hall twin: 441 live points, 88 messages per second, on a 2 vCPU Xeon at 2.1 GHz.
Edge
On site. Screens keep working when the WAN is down.
Cloud
Many small sites into one central NOC.
Hybrid
A box per site, every site in one view.
05 / Honest data
Missing data never stays green.
A screen that keeps showing the last good value after a gateway dies is lying to you. Here a value turns stale after three missed updates, and equipment that has gone quiet turns grey.
- ALARM
- A rule says act now: a leak, a trip, a hot cell
- WARNING
- Drifting out of range, before it becomes an alarm
- OFFLINE
- Every point has gone stale: the link is the problem
- UNKNOWN
- Has never reported since the twin started
- STANDBY
- Stopped by design, ready to take over
- ACTIVE
- Doing something worth seeing: a door open, a battery discharging
- NORMAL
- Fresh values, inside every limit
Where it works
Built for the rooms that cannot go down.
One platform, with a pack for each kind of critical room: the equipment it holds, the limits that matter and the views its operators need.
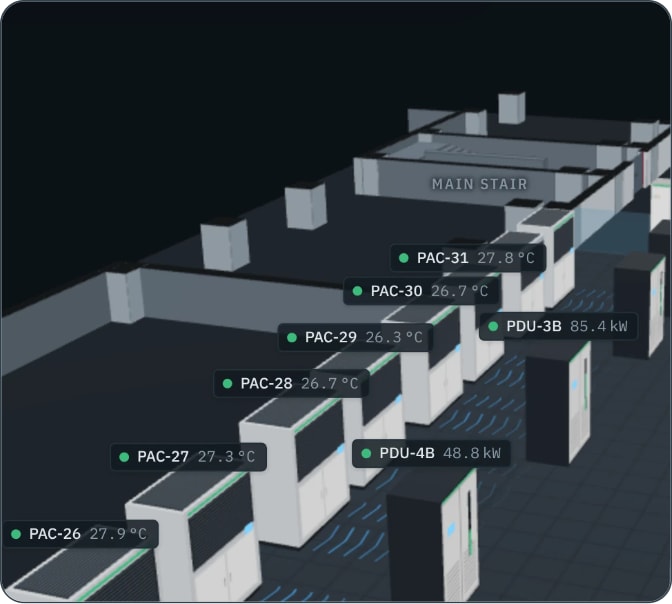
Data-centre halls
Cooling units, PDUs, rack inlets, leaks and doors across the whole hall.
PAC · PDU · RACK · THS · LEAK · DOOR
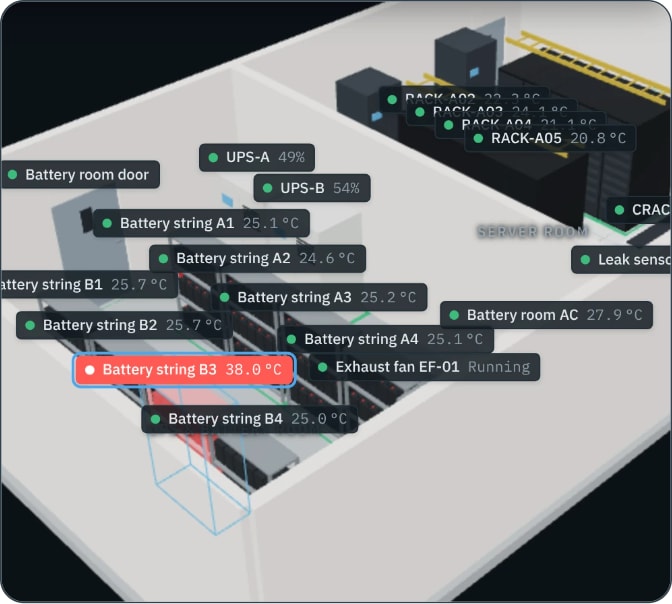
UPS and battery rooms
String temperature, hydrogen, exhaust fans and UPS mode, in one view.
UPS · BATT · H2 · EXF
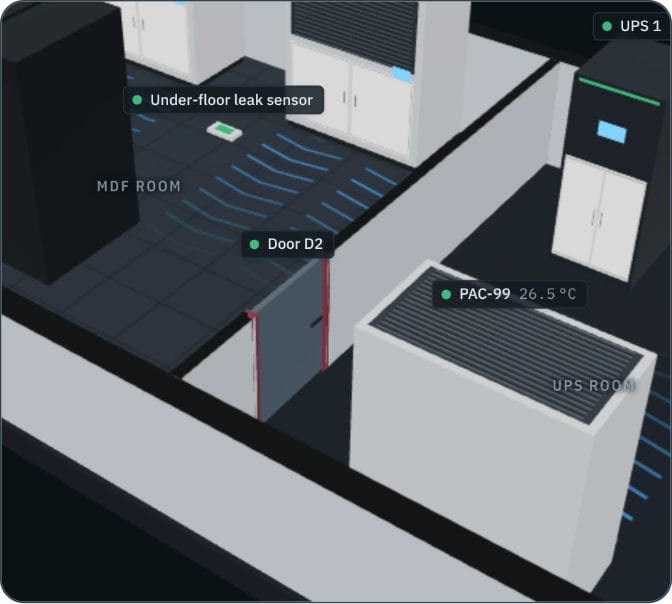
MDF/IDF rooms
Many small rooms: temperature, UPS, doors and leaks in each one.
RACK · THS · UPS · DOOR · LEAK
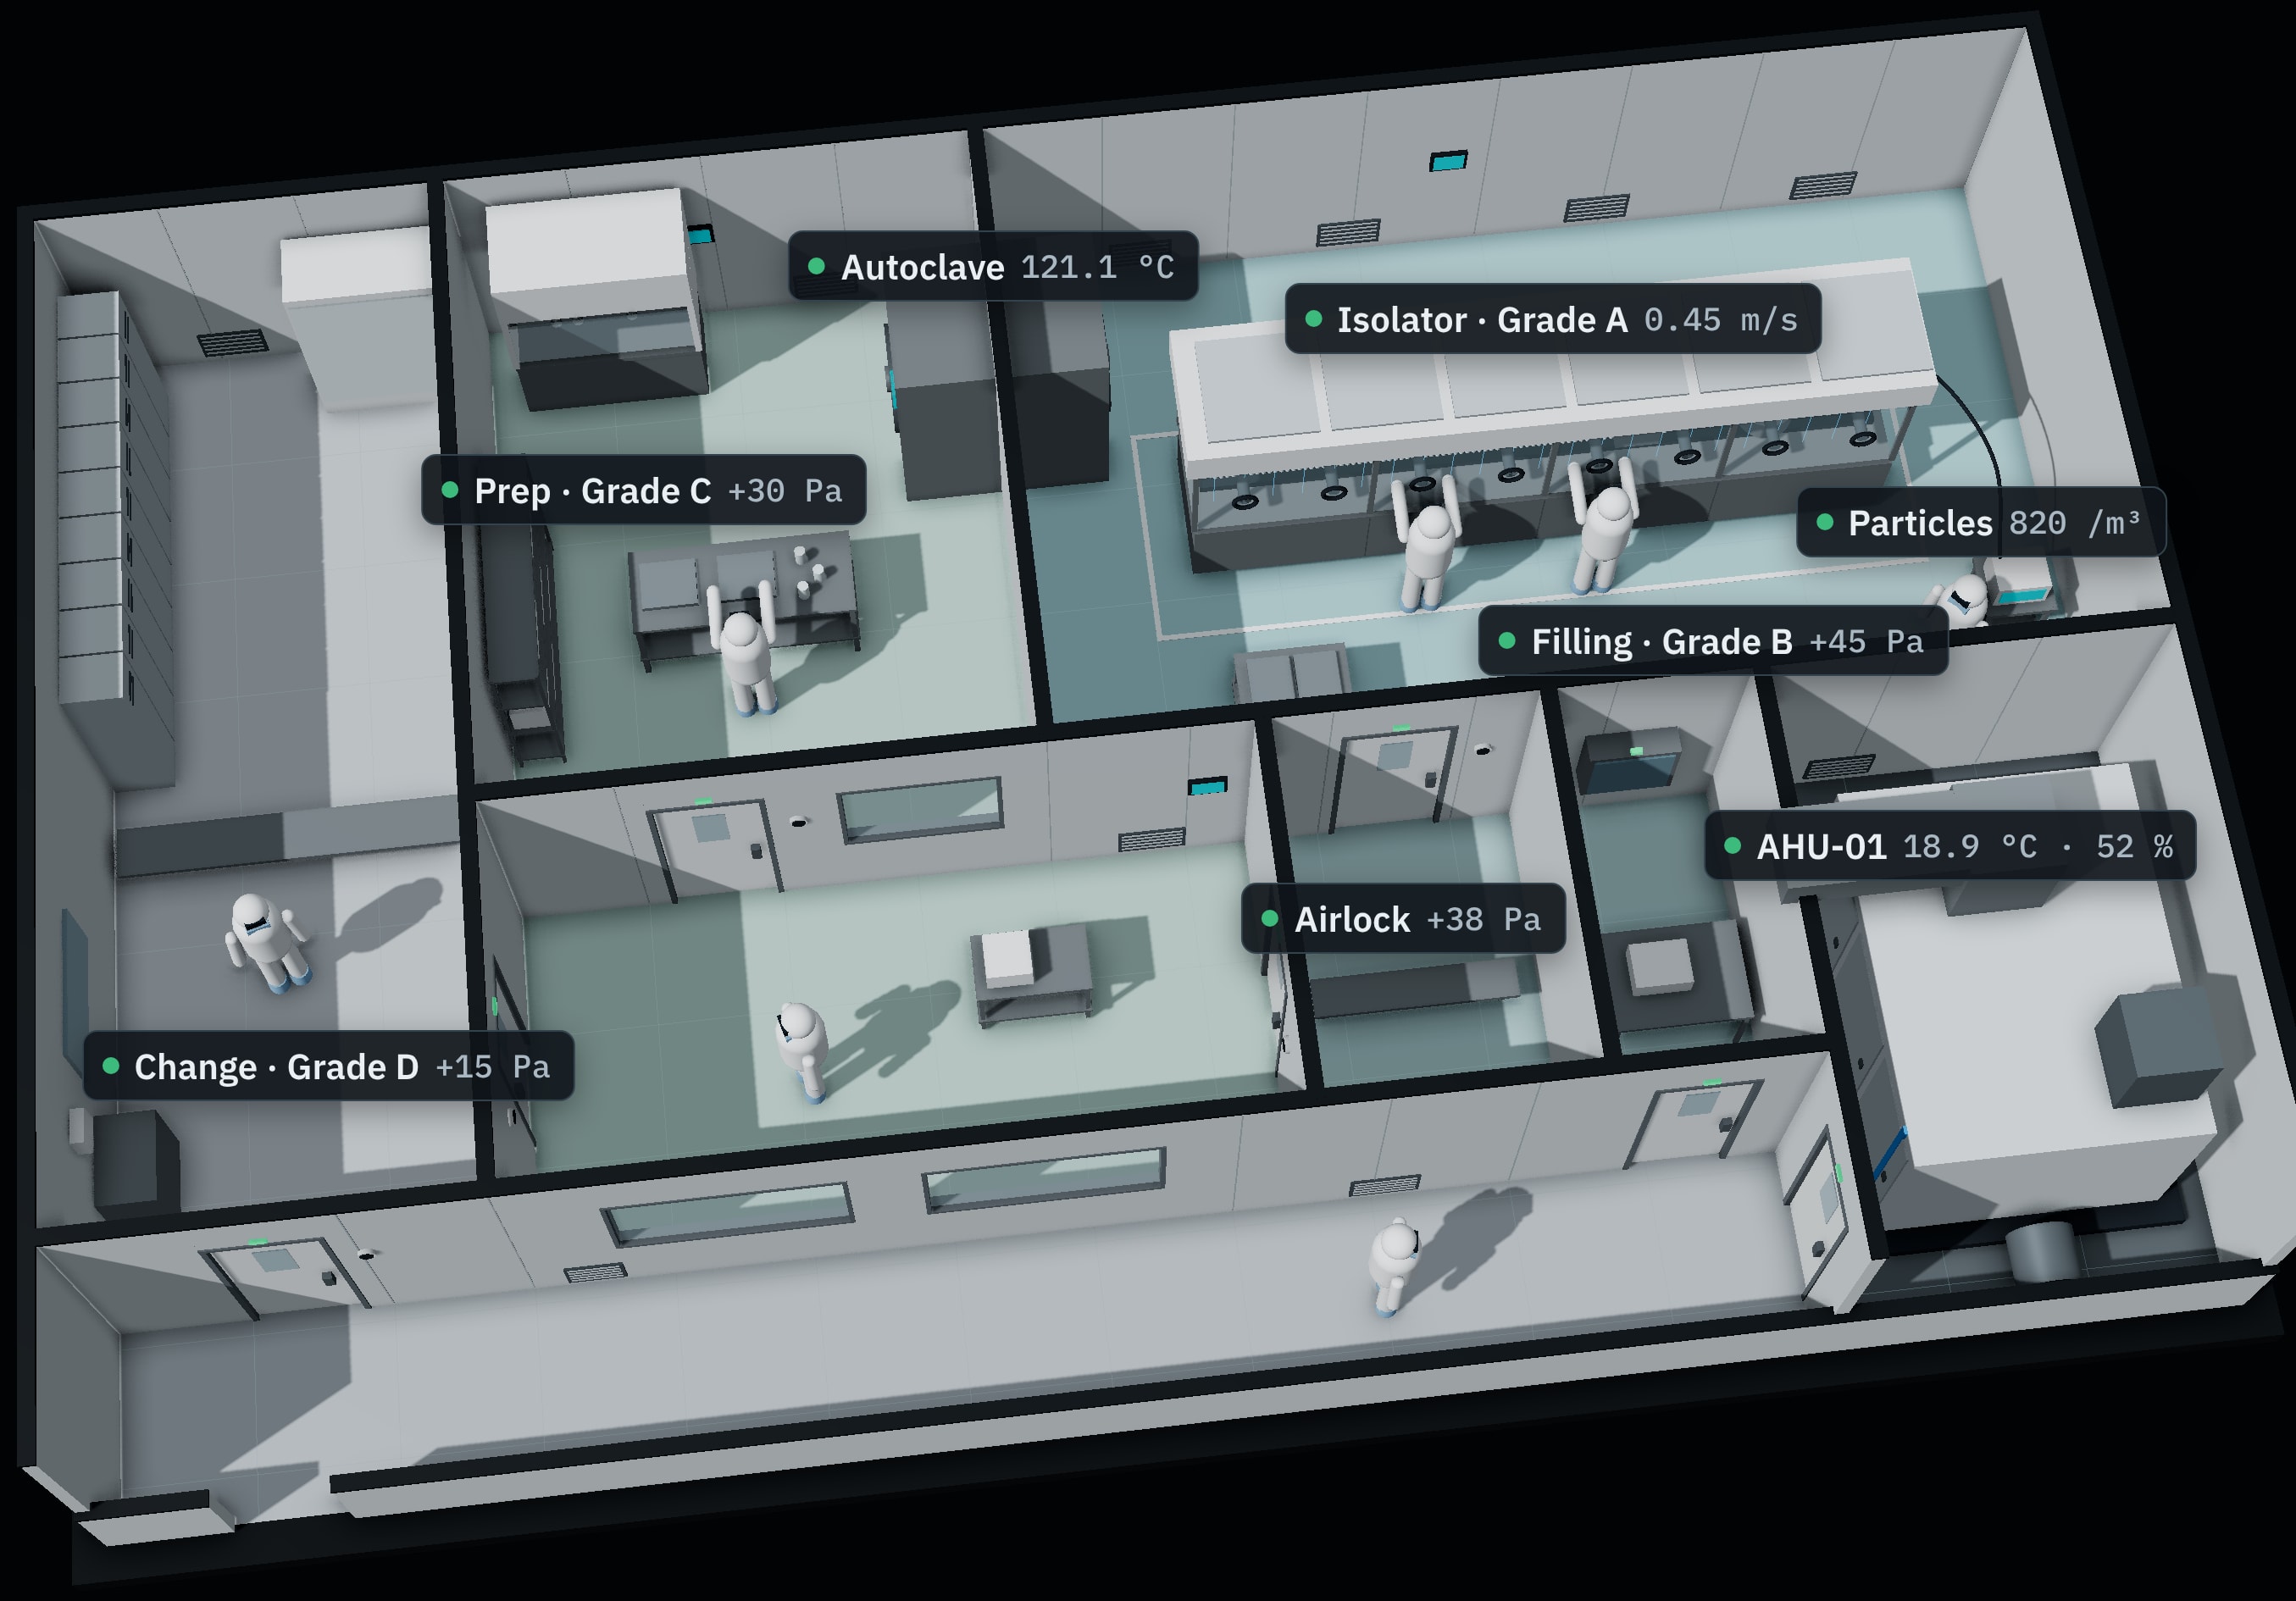
Cleanrooms
Pressure cascades, particle counts and validated records.
ΔP · PARTICLES · AHU · FFU